How to debug SQL-Queries in Shopware 6?
There are always situations where you need to get the raw SQL query. Maybe to understand what is going on, to debug a problem on a production system or just for playing around in your favorit MySQL client to adjust the query. So let’s see what kind of options you have to get the SQL query in Shopware 6.
What should I use to debug the SQL in Shopware 6?Link to this section
- Using the Symfony Profiler to debug SQL
- Using the FrosthDevelopmentHelper to debug SQL
- Using the Dbal/EntitySearcher to debug SQL
Using the Symfony Profiler to debug SQLLink to this section
This is a nice way when you have already a local environment that is running in development mode. You do not need to install anything. Just make sure the Symfony toolbar (profiler) is working. Let’s say you want to know how much time the entity search you preforming is taking. Expect you have some code example like the following.
$criteria = new Criteria($promoProducts);
$criteria->addAssociation('children.cover');

$productResult = $this->productRepository->search($criteria, $this->context);
So we searching for some defined product ID’s that are used for some promotion. How can we now find this exact query with the Symfony profiler ? First you need to add some title to the criteria.
$criteria->setTitle('promo-tree-items');After that you should reload your testing page (where the query is fired) and then click on the conection_collector (Doctrine) icon in the toolbar.

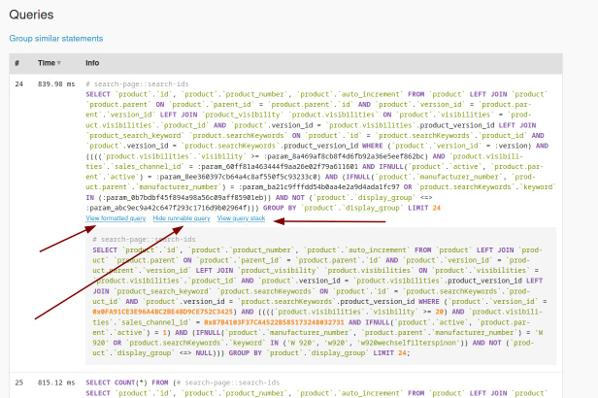
After that you should see a page, like the following, where you can search with STRG + F for your defined title (in our example “promo-tree-items”).


You will see multiple queries that collecting all the data you requested. To know the complete time you need to sum up all the queries where your title is set. In our example there where twelve queries with our criteria title. You can also group similar queries at the top.
Using the FroshDevelopmentHelper to debug SQLLink to this section
This solution is helpful when you want to debug SQL queries in CLI commands.
First of all you need to install the FroshDevelopmentHelper. And we want to install it only for the local development environment. So we add it with composer to the require-dev part of the composer.json with the following command.
composer require frosh/development-helper --devAfter that you need to install and activate this plugin FroshDevelopmentHelper for Shopware 6.
bin/console plugin:install FroshDevelopmentHelper --activateNow you need to add somewhere in your CLI command this small snippet. It will output all queries to your terminal.
\Shopware\Production\Kernel::getConnection()->getConfiguration()->setSQLLogger(
    new \Frosh\DevelopmentHelper\Doctrine\EchoSQLLogger()
);
Using the Dbal/EntitySearcher to debug SQLLink to this section
This could be helpful when you need to debug some SQL queries on a production environment.
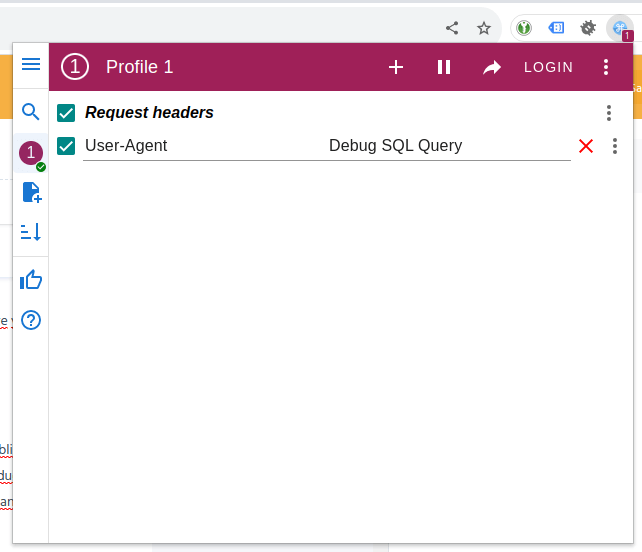
First of all navigate to this file: vendor/shopware/core/Framework/DataAbstractionLayer/Dbal/EntitySearcher.php and take a look at the public search function. Let’s assume we need to debug a query related to an entity. Then we need some debug code here to output the SQL from the production environment. First we need to identifiy us and do not break the page for other users. So we will use a chrome plugin called ModHeader to manipulate a header we sent to the server. Let’s use the user-agent header and write down some string where we are sure that is us.
Let’s add the code (from below) at Line 103 in vendor/shopware/core/Framework/DataAbstractionLayer/Dbal/EntitySearcher.php .
⚠ But be careful. You can break the complete page! Test this in stage or dev environment first. ⚠
$request = \Symfony\Component\HttpFoundation\Request::createFromGlobals();
$userAgent = $request->headers->get('user-agent');
if ($userAgent === 'Debug SQL Query') {
$logFile = '/srv/www/var/log/sql-debug.log';
if (file_exists($logFile)) {
$message = $query->getSQL() . PHP_EOL;
file_put_contents($logFile, $message, FILE_APPEND);
}
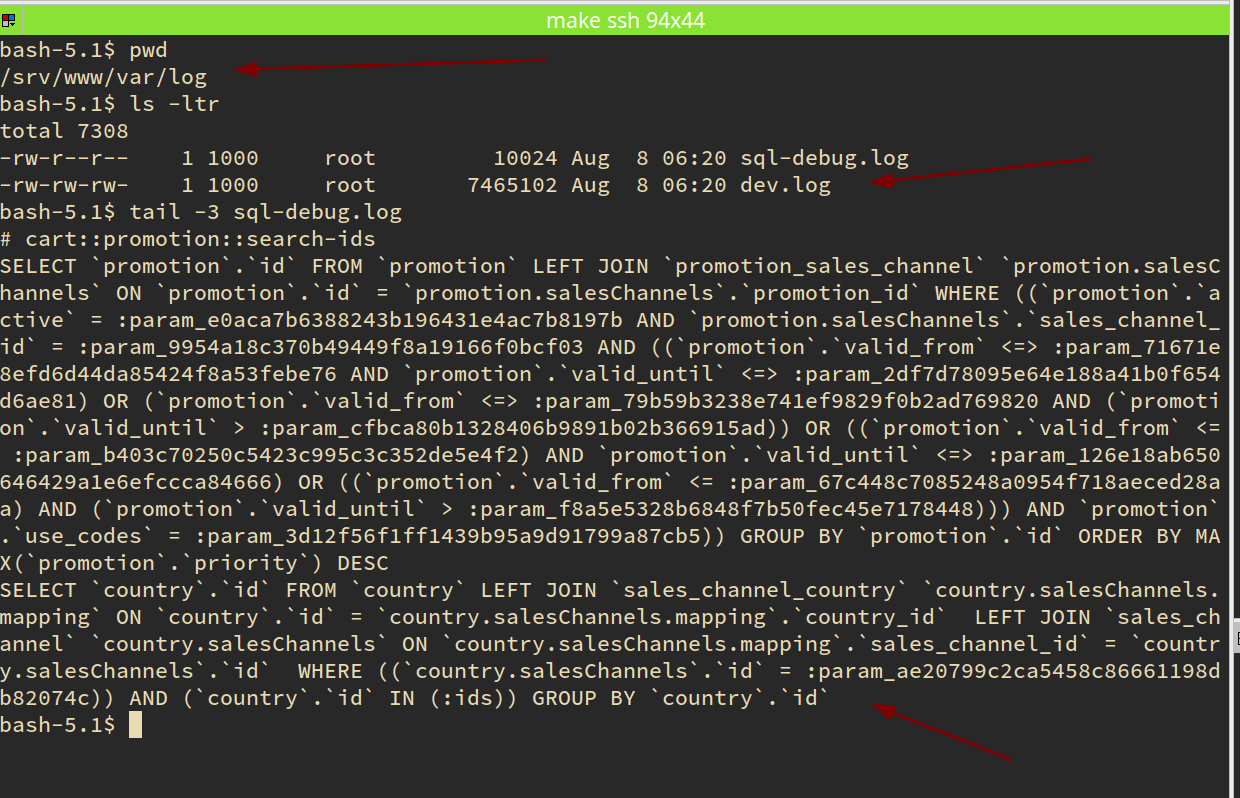
}When you read the code you will see that we have to create a file called sql-debug.log in the default var/log/ folder from your Shopware 6 instance and then update the code with your absolute path to that file (in our example it is /srv/www/var/log/sql-debug.log ). In the image below you can see that we tail -f sql-debug.log and now our log file gets filled when we use the page with the before defined User-Agent.
And now enjoy to search for your slow queries and test them with EXPLAIN ANALYZE in your favorite SQL-Client 😉
Anything missing or can be improved?
Pls tell me in the comments. Cheers.